About author: Paulina Poliszewska leverages her expertise in media buying to optimise paid campaigns, ensuring maximum ROI and successful outcomes for DTC brands.
Facebook advertising can be incredibly effective for your business, enabling you to leverage advanced marketing tools and a wealth of user data to crush your objectives.
However, if you want to maximise the return on investment you generate with Facebook, then you’ll need to be able to access, interpret, and analyse ad performance data.
And for some marketers, this can be an issue.
Boost E-Commerce ROI: Download Our Free CPA & ROAS Calculator
While Facebook does offer a range of different reporting tools and features, sometimes it can all become a little bit cluttered. But if you’re feeling overwhelmed by Facebook reporting data, then fear not – this guide is for you.
We’re about to explain how you can utilise Google Data Studio (also known as Looker Studio) to build a simplified, user-friendly dashboard that makes Facebook reporting a breeze. Let’s get started.
As a specialist Facebook advertising agency and Google ads agency we can help you with your campaigns just get in touch for a free consultation.
Why you should be using Google Data Studio with Facebook Ads
There are two main reasons why you should be leveraging Google Data Studio for your Facebook Ads reporting needs.
Firstly, Google Data Studio allows you to quickly build reporting dashboards that are convenient to use and easy to navigate. The faster you’re able to access and analyse Facebook performance data, the easier it will be to implement optimisations.
Secondly, using Google Data Studio means you’re no longer viewing Facebook ad performance in isolation.
While there’s nothing wrong with Facebook’s built-in reporting features, they don’t provide you with a holistic perspective on marketing performance.
Google Data Studio enables you to pull data directly from Google Analytics, so you can understand exactly how Facebook advertising is contributing to your business goals – as well as compare Facebook Ads to other partners and channels.
Getting started with Google Data Studio & Facebook Ads – manual set-up
Google Data Studio can make Facebook reporting significantly more convenient – but there is some preparation required to get things up and running.
While data from native Google channels (i.e. Google Ads) is quick and easy to import, you’ll need to complete a few extra steps to integrate Facebook Ads data into the Google Data Studio platform.
However, there’s no need to worry. This process is more than worthwhile in the long run, and we’re about to provide you with step-by-step instructions for manually importing Facebook data into Google Data Studio.
Stage 1: Export your Facebook Ads data in a report
The first thing you’ll need to do is prepare your Facebook Ads data for extraction so that you can easily export the right file for Google integration.
(An important note – Facebook conversion data is only available at the top level, so you won’t be able to view conversions by platform or placement. Instead, you’ll need to track conversions by Campaign/Ad Sets/Time Period for ROI calculations. However, you’ll still be able to view metrics like Impressions/Clicks/CPC at the platform/placement level!)
Step 1
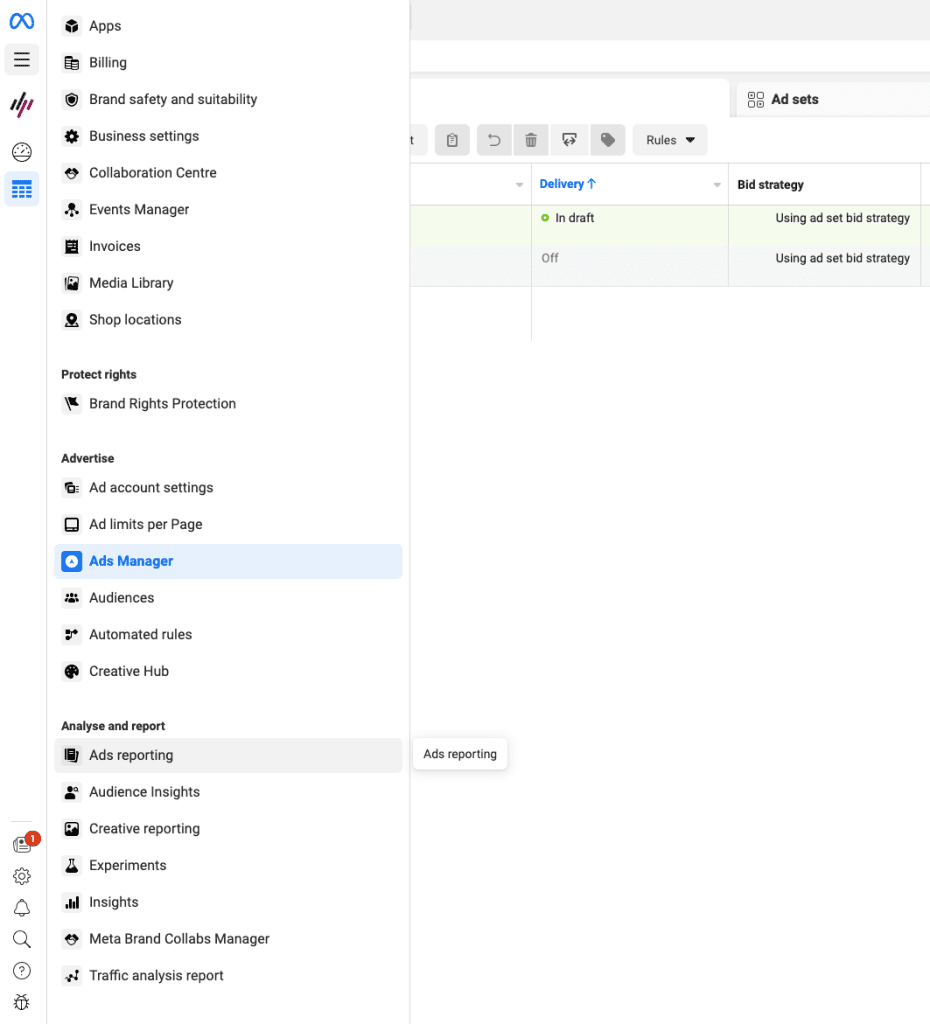
Log into your Facebook account, and start by accessing the ‘Ads reporting’ menu in the Facebook Ads Manager. Click ‘Create Report’ to get the ball rolling.
Step 2
Select the relevant metrics (i.e. Reach, Impressions) and dimensions (i.e. Campaign Name, Placement) that you’d like included in your report. Think carefully about the data points that will be most useful for reporting and optimisations.

Step 3
While you don’t necessarily need to schedule regular Facebook reports, getting them sent directly to your inbox will make consistent reporting infinitely easier. You can opt to receive reports on a daily/weekly/monthly basis and also specify the day(s) you’d like for delivery.
Step 4
You’ll receive your Facebook Ads report in a basic CSV or Excel format, but it may need to be adjusted so that Google Data Studio can process it. For example, you might have to tweak the formatting of dates or other numbers before you import the data.
Once you’ve successfully created and downloaded a Facebook report, it’s time to import this all-important data into Google Data Studio and connect Facebook Ads to the platform.
Stage 2: Import the Facebook data into Google Data Studio
Step 1
First things first, you’ll need to convert your report file from Excel to Google Sheets. You can do this by uploading the Excel file directly into your Google account (i.e. Google Drive) where you’ll automatically be prompted to convert the report into a Google Sheets doc.
Alternatively, you can create a new Google Sheet, select “Open” from the File Menu, and then click “Upload”.
Step 2
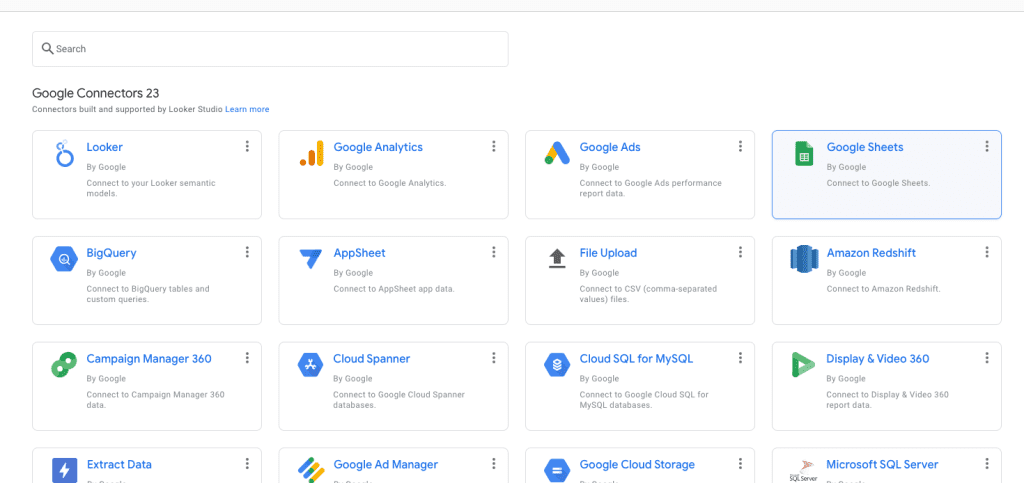
Once you have the Google Sheets file ready, it’s time to connect the doc to Google Data Studio. You can do this by hitting ‘Create’, ‘Data Source’, and selecting ‘Google Sheets’ from the Connectors list in Google Data Studio.
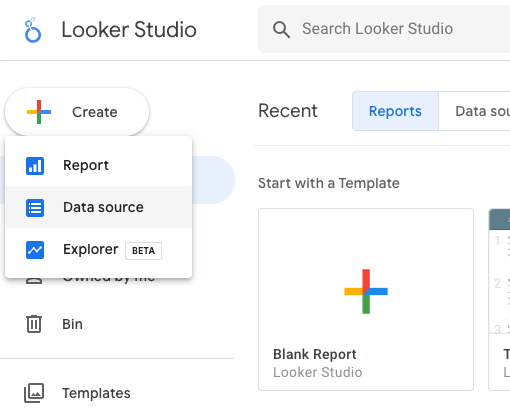
(You’ll only need to create this connection once.)
Once your Google Sheets report has been connected, any changes made to the data will be automatically reflected in the Data Studio dashboard. It’s very important to double-check that everything is pulling through correctly, or you may encounter some issues when trying to calculate metrics like CPC and CPM.
Getting started with Google Data Studio & Facebook Ads – automated options
We’ve just covered how to manually import Facebook Ads data to Google Data Studio – but if you’re looking for more time-efficient methods, we have good news. There are several ways to automate the data-import process, allowing you to quickly populate Google Data Studio with the latest Facebook figures.
By automating this reporting process, you can spend less time preparing files and more time gathering valuable performance insights.
Platforms like Zapier are designed to inject some much-needed automation into manual tasks, and you can use these tools to set up auto-imports from your Facebook email attachments directly into Google Sheets.
Once you’ve built the initial automated workflow, your scheduled Facebook email reports (whether they’re daily, weekly, or monthly) will be automatically transferred over to Google, which will immediately refresh the numbers in Google Data Studio.
Voila – you can now access up-to-date Facebook reporting statistics from Google Data Studio, whenever you need them.
There are several automation tools that can be used for this process, but the key is to find a platform that will significantly reduce the amount of time you spend importing Facebook data.
Building a reporting dashboard in Google Data Studio
Importing data from Facebook Ads to Google Data Studio is just half the equation. Having these figures in the platform is great, but if you want to gather insights quickly and easily, you’ll need to find a way to organise and visualise your reporting data.
This is where a streamlined and informative dashboard can be a game-changer.
Google Data Studio enables users to build a customised dashboard for reporting purposes – and we’re about to explain how.
Step 1 – Start setting up your dashboard
To get started with a dashboard in Google Data Studio, add some basic design elements such as your company logo or a date range. You can mark any of these elements as ‘report level’, which means they’ll be applied to every page across your dashboard.
Step 2 – Decide how to visualise your Facebook data
Once you’ve selected a theme for your dashboard, it’s time to start thinking about how you want to visualise your Facebook data.
Play around with different tables, charts, and scorecards until you find a format that’s clear and accessible.
Every advertiser will have different requirements here, but try to ensure that you can analyse campaign data at a glance. For example, you might want to summarise key metrics at the top of the page with basic scorecards, and then build more in-depth visual charts that display performance over time, or delivery versus KPIs.
If you can instantly view and analyse the Facebook data that’s most important to your business, then you’re on the right track. For those struggling to choose the right charts, you can also select a pre-built studio template to make things easier.
Step 3 – Add any additional reporting features
Once you’re happy with the design elements and data visualisations in your dashboard, you can begin experimenting with additional features such as filters and sliders.
These features make it easier for you to delve into more granular Facebook Ads data. For instance, you might want to add a drop-down list that shows a specific subset of data, or a button that allows you to segment charts by platform.
There are a huge number of different ways to display your data within Google Data Studio, so it’s all about tweaking your dashboard until you’re comfortable with the layout.

(Source: lookerstudio.google.com)
Adding data sources to your Google Data Studio account
Need to connect more external data to the Google Data Studio? No problem.
Just follow the instructions below to add a new data source (e.g. Google Analytics, Google Ads) to the platform.
Firstly, open up Google Data Studio and click the ‘Resource’ dropdown menu. Hit ‘Manage added data sources’ and then ‘Add a data source’ to start the process.
Select the relevant data source (e.g. Google Analytics) from the connectors list.
(Remember, if you want to import data from an external platform like Facebook, then you’ll need to transfer the data into Google Sheets first. You can then set up the Facebook Ads connector.)
Select the appropriate account, property, and view options, and then proceed. The next window will display all of the metrics and dimensions from your new data set – just click ‘Add To Report’ to continue.
Once your new data source has been successfully added to Google Data Studio, you’ll be able to build reports, charts, and dashboards as normal. Just rinse and repeat this process whenever you need to analyse more external data from a different platform!
How to combine multiple datasets within Google Data Studio
One of the most useful features of Google Data Studio is the ability to compare data directly between multiple sources.
For example, rather than needing to build a separate dashboard for Google Analytics and Facebook Ads data, you can create charts that incorporate both datasets. This allows you to analyse the relationship between different metrics more easily.
For instance, you might look at the correlation between Facebook ad impressions and website sessions to better understand the impact of your marketing spend.
Below are step-by-step instructions that will allow you to blend multiple datasets in Google Data Studio.
Option #1 – Combine existing visualisations in Google Data Studio
If you’ve already built separate charts/data visualisations within Google Data Studio, the easiest option is to combine them.
To do so, just select the different visualisations you’d like to merge and hit ‘Blend data’. This will instantly combine the data sources into one chart, allowing you to easily compare and contrast multiple datasets.
Option #2 – Combine datasets from the Resource menu
The second option is to merge datasets from the Google Data Studio ‘Resource’ menu.
To get started, open up the ‘Resource’ menu and then click ‘Manage blended data’. Hit ‘Add a data view’ and then select two or more datasets that you’d like to combine.
Select your desired join key (i.e. a shared dimension between the datasets) and then confirm to complete the process.
Combining datasets is a fantastic way to get a clearer perspective on your marketing strategy, as you can compare different platforms/metrics and explore the relationships between them.
You might find some surprising platform insights and knock-on effects between marketing channels, so don’t be afraid to play around with different dataset combinations!

(Source: google.com)
Creating advanced reports in Google Data Studio
We’ve already covered the steps required for basic Facebook Ads reporting in Google Data Studio.
But what about generating advanced reports? What if you’re looking to deep-dive Facebook performance and understand more about your wider marketing strategy?
We’ve got you covered.
If you want to build more insightful reports within Google Data Studio, you really just need one thing – accurate & organised data.
The more data sources you’re able to integrate into Google Data Studio, the better you’ll be able to understand the impact of different marketing channels (e.g. Facebook) on your business objectives. However, gathering reliable data is often easier said than done.
Below are a few best practices that will help you to create more complex, in-depth reports in the Google Data Studio platform.
Think about the data sources you’ll need
This may sound obvious, but you need to ensure that you have access to all of the data necessary to build your advanced reports. For example, this could be data directly from your website, CRM database, marketing channels, or platforms like Google Analytics.
Map out all of the data points you’d like to track (e.g. conversions, sales value, impressions, website visits) and make sure that you can collect them.
Identify your key metrics – and stay focused on them
When you’re handling a lot of different datasets and building complex reports, it’s very easy to start drowning in statistics.
However, if you want to make the most of Google Data Studio, it’s vital to stay focused on your core objectives and key metrics. Don’t be distracted by numbers that aren’t relevant to your goal – establish your primary metrics early on, and make sure that every report and calculation revolves around them.
Assess the quality of your data
Gathering data is crucial for building more advanced reports – but you always need to make sure that your data is accurate, up-to-date, and reliable.
For instance, if you’ll be utilising conversion numbers from a Facebook website pixel, it’s absolutely crucial to double-check that the data is pulling through correctly. Inaccurate data will throw a major spanner in the works for your reporting, so always complete the due diligence before you start building reports.
What are the different Facebook Ads metrics available in Good Data Studio?
There’s a wide range of Facebook Ads metrics that can be imported from the Facebook Ads Manager into Google Data Studio. Understanding which metrics are most relevant to your marketing objectives is critical for effective reporting.
Below are the primary Facebook Ads metrics that you can view in Google Data Studio:
Facebook Awareness Metrics
- Ad Spend (e.g. campaign budget, ad set, amount spent, etc)
- Impressions
- Reach & Frequency
- CPM
Facebook Engagement Metrics
- Clicks
- Likes/comments/reactions/shares
- CTR
- Engagement Rate
- Video Views/Video Play Time
Facebook Conversion Metrics
- Custom Conversions (e.g. completed purchases, add-to-cart, page views)
- Leads/Cost Per Lead
- CPA
- Purchase Value
- ROAS (Return On Ad Spend)
There are many different Facebook Ads metrics that can be analysed in Google Data Studio, but you’ll need to focus on your priority data points to avoid being overwhelmed.
It’s also worth noting that these metrics can be aggregated and viewed in multiple ways (e.g. total conversions, unique users) so you may need to experiment with different visualisations until you find charts that fit your reporting needs.
The different chart types available in Google Data Studio
You can build a huge number of different chart types in Google Data Studio, and each will provide you with a unique perspective on your Facebook Ads data.
Let’s run through some of the most popular chart types, and explain when they might be most useful in the Facebook reporting process.
Chart Type #1 – Facebook Performance Overview Table
This basic table will allow you to collate all of your Facebook ads account data in one convenient chart. This is a great way to get a quick snapshot of total campaign delivery and review high-level metrics at a glance.
Use these chart settings to build a Facebook Performance Overview Table:
- Data Source: Facebook Ads
- Chart Type: Table
- Dimension(s): Campaign Name
- Metric(s): Impressions, CPM, Clicks, Engagements, Purchases/Conversions
- Select “Show Summary Row” for convenient totals
Chart Type #2 – Audience Breakdown Bar Chart
Visualising the demographic breakdown of new customers/conversions is a brilliant way to understand your most valuable prospects. You can then use this data to inform your Facebook strategy, tweaking your creative messaging and audience targeting.
Use these chart settings to build an Audience Breakdown Bar Chart:
- Data Source: Facebook Ads
- Chart Type: Bar Chart (Stacked)
- Dimension(s): Age
- Breakdown Dimension(s): Gender
- Metric(s): Purchases/Leads/Conversions
- Sort By: Age (Ascending/Descending)
Chart Type #3 – Year-On-Year Line Graph
If you want a macro view of Facebook Ads performance, a YoY line graph is a handy way to visualise results over time. You can also set up multiple lines to compare different platforms or assess results versus benchmarks/objectives.
Use these chart settings to build a Year-On-Year Line Graph:
- Data Source: Google Analytics/Facebook Ads
- Chart Type: Time Series
- Dimension(s): Date
- Metric(s): Website Visits/Conversions/Clicks etc
- Time Period: Year vs Year
- Segment: Paid traffic/conversions from Facebook sources
Google Data Studio is a fantastic option for social media marketers looking to streamline their Facebook reporting. After all, the easier your reports are to digest and analyse, the easier it will be to implement smart optimisations.
Just remember the fundamentals whenever you’re using Google Data Studio for reporting purposes.
Make sure you’re extracting Facebook data correctly, double-check the accuracy of any new data sources, and build practical charts that are easy to use. Tick all of these boxes, and reporting on Facebook Ads will be easier than ever.